Financials
Use this report to analyze costs in several categories:
-
Net income (or loss) for encounters
-
Net income (or loss) by financial class
-
Cost of inpatient encounters
Click image to view full size
Slicers
This report provides filtering options that let you create a set of data, giving you the option of viewing the precise data you want to view.
Entity
The entity drop-down lists all of the clinics, hospitals, and other entities that comprise your institution. You can choose to view all of those entities or select a single entity to view.
Patient type
The patient drops-down lists the ways a patient was seen, such as inpatient or outpatient emergency. The list will show the patient types used in your organization.
Age
The age drop-down lists these age categories: 0-17, 18-49, 50-64, 65-84, and 85+. You can also select all or blank.
Discharge date range
This control lets you select a range of dates of discharge. You can use the slider or, for more precision, click on each date box to choose a date from a calendar.
TIP: Use the dashboard tools to view, export, and sort the data; view data as table; and more.
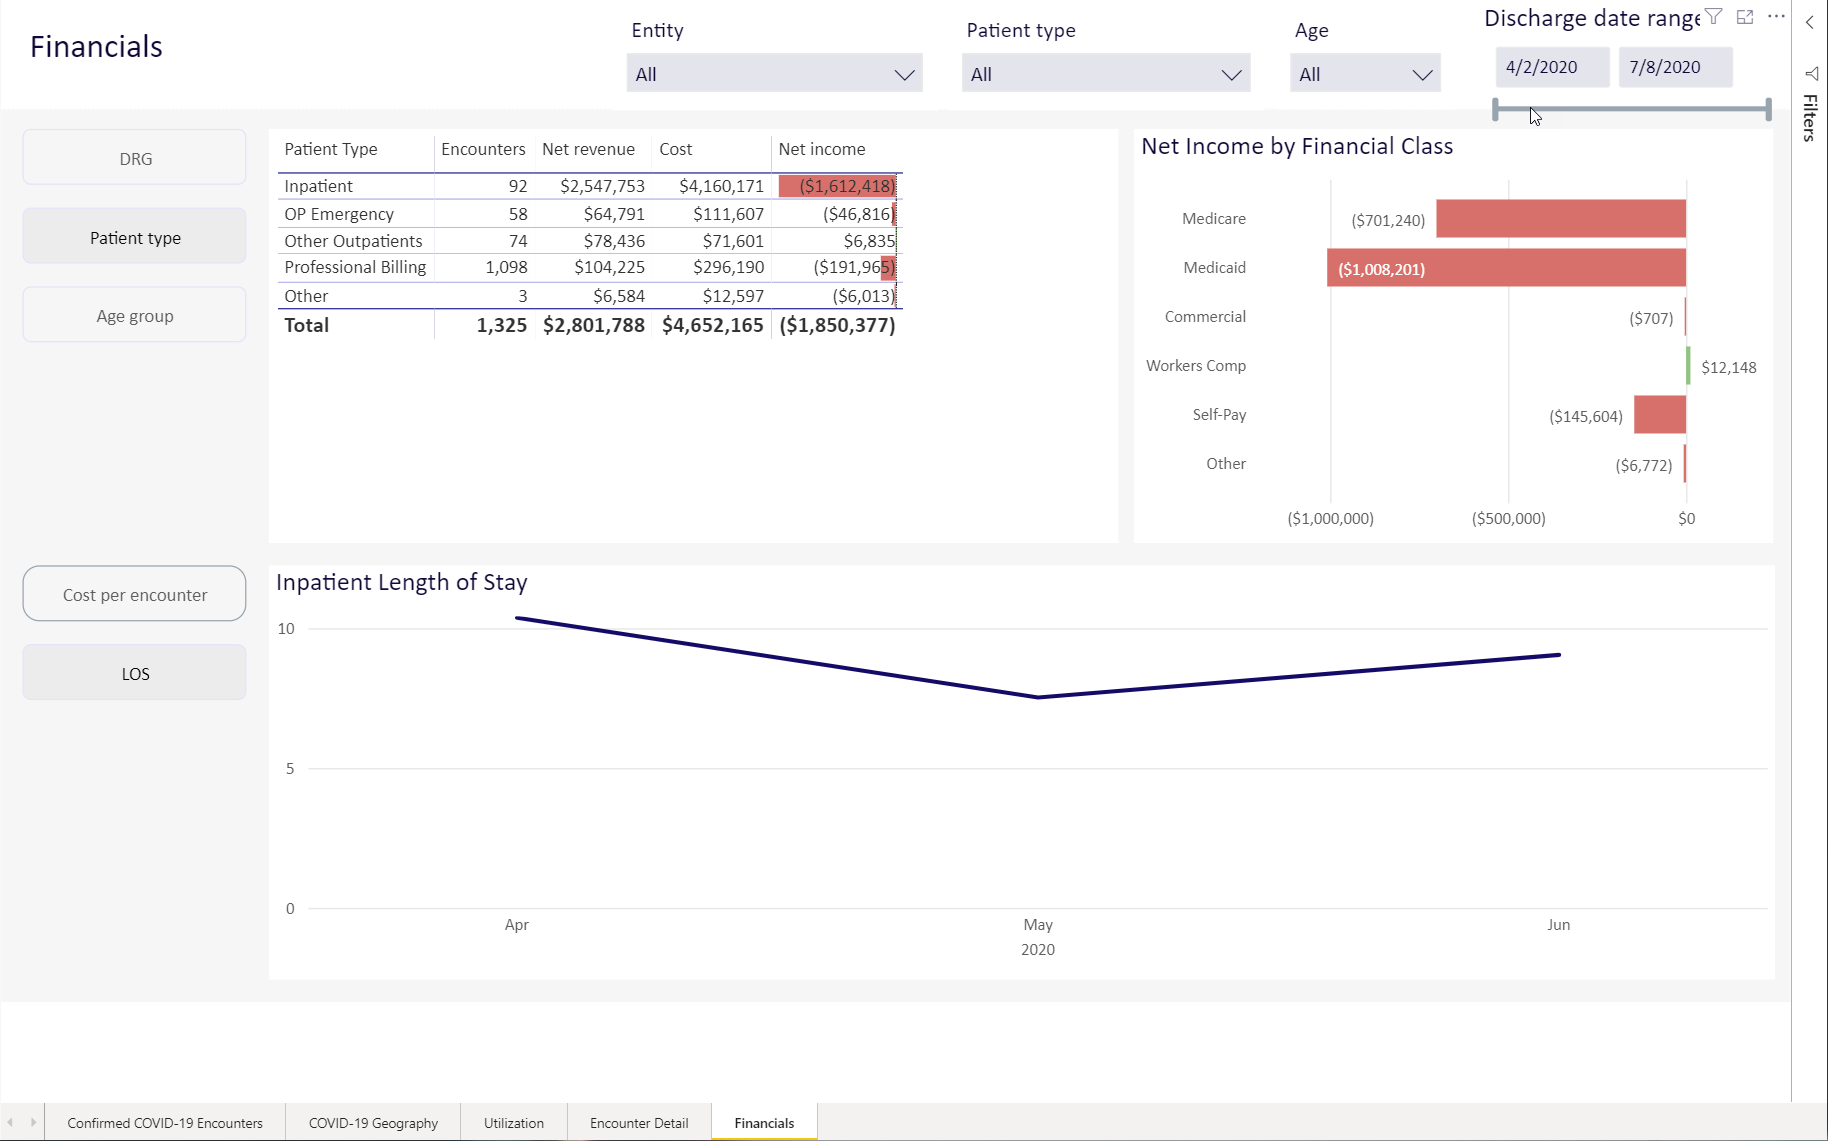
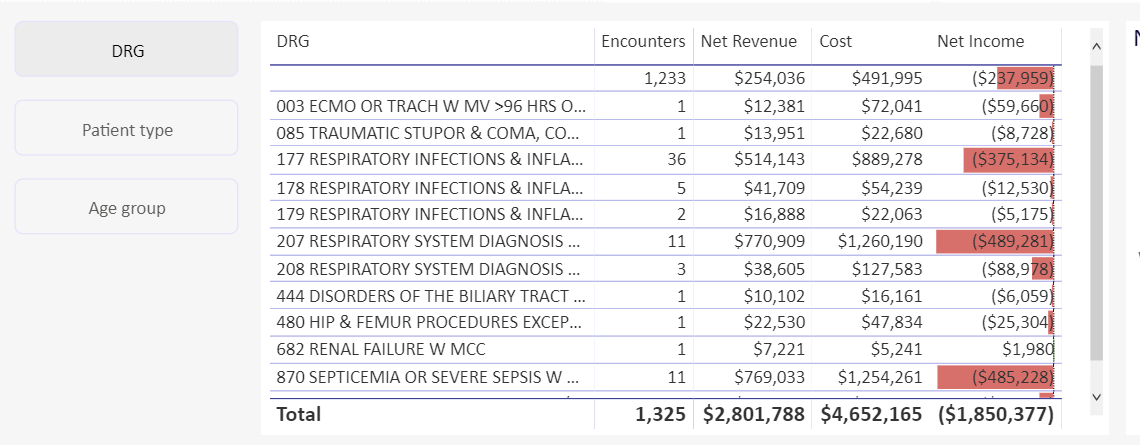
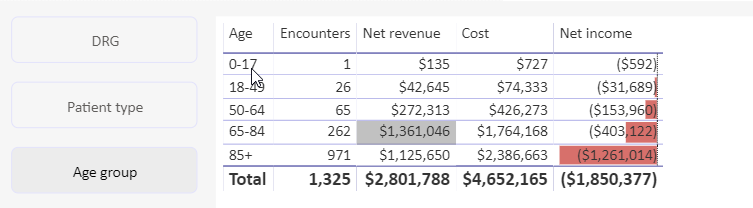
Viewing encounter data
This filter contains three visualizations.
Net income for encounters
This table contains a list of all encounters that occurred in the discharge date range for the patients and entities that you chose.
You can choose between three different views of the table: by DRG, by patient type, or by age group.
DRG view
This view presents encounter financial data with a focus on individual encounter types.
Click image to view full size
| DRG | All the encounters types that occurred, according to your filters, are listed. The DRG number and the description of the encounter type are provided |
| Encounters | A count of the encounters, according to your filters |
|
Net Revenue |
The dollar amount of revenue received for each encounter type |
| Cost | The cost of the encounters to your organization |
| Net Income | The net income is the subtraction of the net revenue from the cost. Dollar amounts enclose with parentheses and shaded red indicate a net loss. Dollar amounts shaded green indicate a net profit |
Patient type view
This view presents encounter financial data by the types of the patients.

Click image to view full size
| Patient type | Patient types are: inpatient, outpatient emergency, other outpatients, professional billing, and other |
| Encounters | The number of encounters, according to filters, for each patient type |
| Net Revenue | The revenue received for the encounters for each patient type |
|
Cost |
The cost for those encounters |
| Net income |
The net income is the subtraction of the net revenue from the cost. Dollar amounts enclose with parentheses and shaded red indicate a net loss. Dollar amounts shaded green indicate a net profit |
Age group view
This view present encounter financial data by standard age ranges.
Click image to view full size
| Age | The age ranges are: 0-17, 18-49, 50-64, 65-84, 85+ |
| Encounters | The number of encounters, according to filters, in each age group |
| Net revenue | The revenue received for the encounters in each age group |
| Cost | The cost for the encounters, by age group |
| Net income |
The net income is the subtraction of the net revenue from the cost. Dollar amounts enclose with parentheses and shaded red indicate a net loss. Dollar amounts shaded green indicate a net profit |
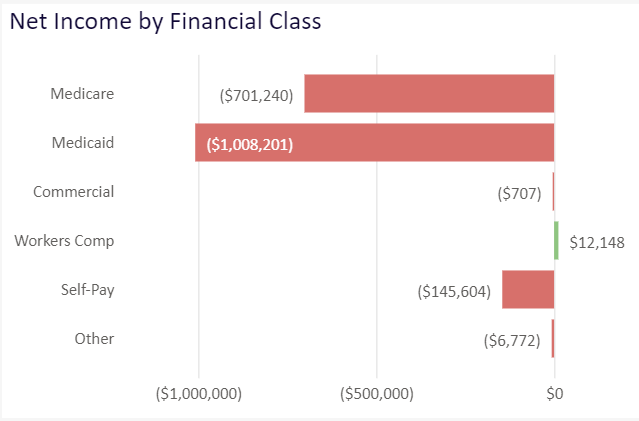
Net Income by Financial Class
This chart explore the net income for this encounter group by the method of payment.
Click image to view full size
The net income for each payment method is given in dollars. The chart also shows that amount as it relates to the cost; marked as $0 on the chart. Items to the left mean the net income was less than the cost of the encounters and are shaded in red. Encounters to the right mean the net income was greater than the cost of the encounters and are shaded in green.
Cost per Encounter
This graph shows the costs of encounters over the range of dates set with the Discharge date ranger slicer. Each month shows an average of for the month. You can move your cursor over the graph to view the dollar values.
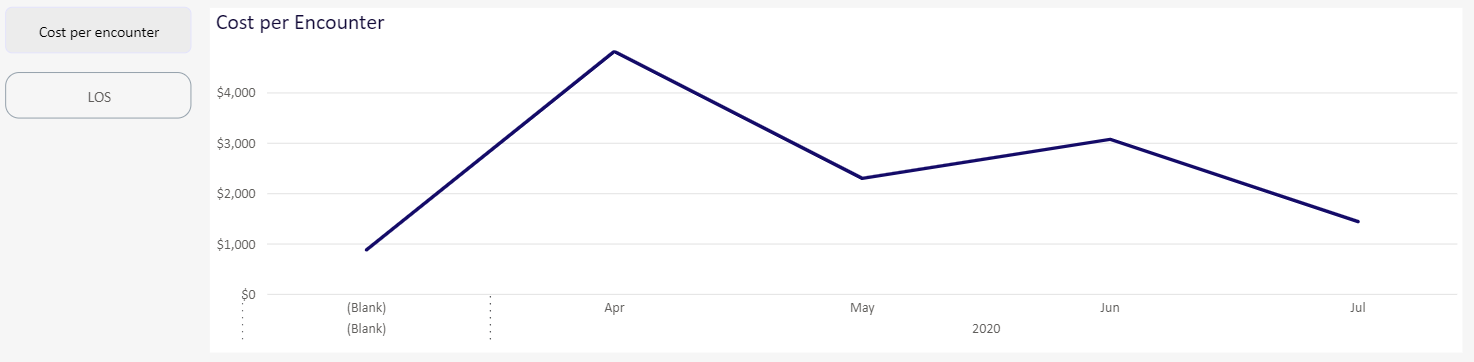
Click image to view full size
Navigation
-
Use the tabs at the bottom of the page to view other related reports in the category
-
Use the Navigation menu in the upper-left corner to return to Recent places that you've visited or to the Intelligence Center.